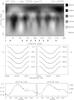
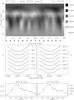
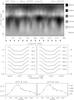
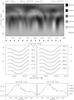
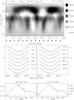
Fig. 7
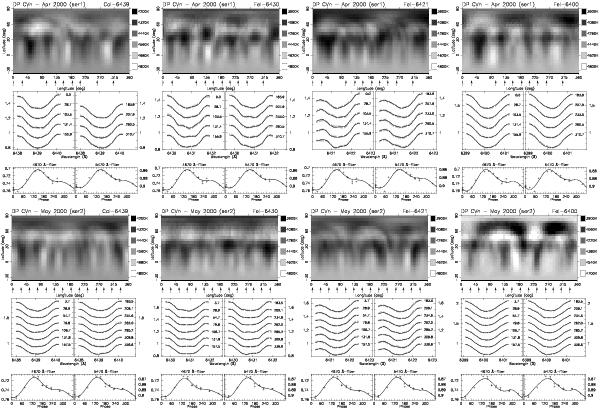
Surface temperature distribution maps of DP CVn for the two available data subsets taken in April 2000 (ser1, top row) and in May 2000 (ser2, bottom row), using Ca i 6439 Å, Fe i 6430 Å, Fe i 6421 Å, and Fe i 6400 Å mapping lines. The temperature maps are presented in a pseudo-Mercator projection from latitude − 35° to +90°. The phases of the observations are marked by arrows underneath. Below surface temperature reconstructions, in the middle panels the fitted line profiles are shown. Small dashes represent the data points and measure the ± 1-σ errors. Simultaneous light curves in Strömgren b and y are plotted in the bottom panels with their respective fits.
Current usage metrics show cumulative count of Article Views (full-text article views including HTML views, PDF and ePub downloads, according to the available data) and Abstracts Views on Vision4Press platform.
Data correspond to usage on the plateform after 2015. The current usage metrics is available 48-96 hours after online publication and is updated daily on week days.
Initial download of the metrics may take a while.