Fig. 5
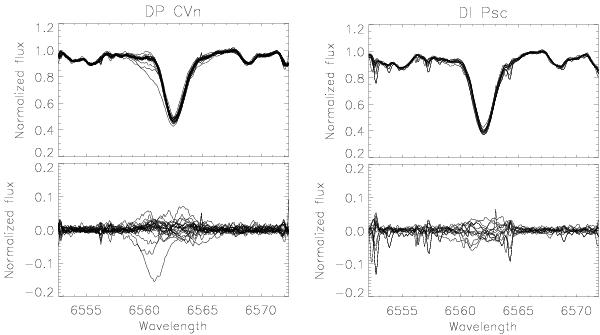
Hα line profiles of DP CVn (left) and of DI Psc (right). In the top panels the observations are plotted together, while in the bottom panels the corresponding averages are subtracted to emphasize the nightly variations. Note the telluric water lines, especially at around 6552.5 Å, 6557 Å, and 6564 Å, as well as the sporadic cosmic peaks.
Current usage metrics show cumulative count of Article Views (full-text article views including HTML views, PDF and ePub downloads, according to the available data) and Abstracts Views on Vision4Press platform.
Data correspond to usage on the plateform after 2015. The current usage metrics is available 48-96 hours after online publication and is updated daily on week days.
Initial download of the metrics may take a while.