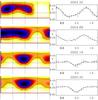
Fig. 12
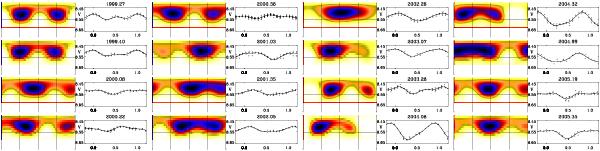
Light-curve inversions for DP CVn. Darker regions indicate larger spot filling factors. The grid in the maps indicates the equator and four longitudes separated by 90°. The observations (crosses) and calculated V and y light curves (solid lines) are also presented. Note that for convenience reasons we use 2 451 250.99805 as the zero phase in the plot, i.e., the time of the first photometric observation we have, yielding a phase shift of +0.240 as compared to the Doppler maps in Sect. 4.2).
Current usage metrics show cumulative count of Article Views (full-text article views including HTML views, PDF and ePub downloads, according to the available data) and Abstracts Views on Vision4Press platform.
Data correspond to usage on the plateform after 2015. The current usage metrics is available 48-96 hours after online publication and is updated daily on week days.
Initial download of the metrics may take a while.