Free Access
Fig. 11
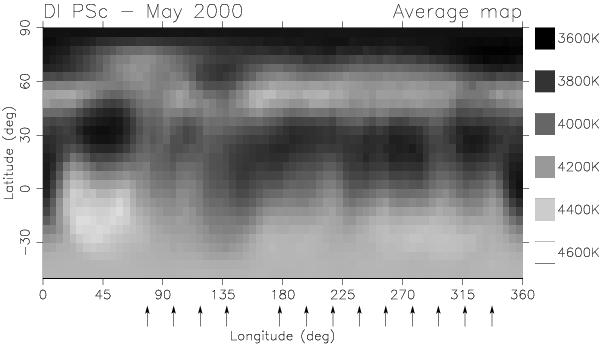
Combined image of DI Psc from the available three individual Doppler reconstructions. The map is presented in a pseudo-Mercator projection from latitude − 50° to +90°. The phases of the observations are marked by arrows below the map.
Current usage metrics show cumulative count of Article Views (full-text article views including HTML views, PDF and ePub downloads, according to the available data) and Abstracts Views on Vision4Press platform.
Data correspond to usage on the plateform after 2015. The current usage metrics is available 48-96 hours after online publication and is updated daily on week days.
Initial download of the metrics may take a while.