Fig. 10
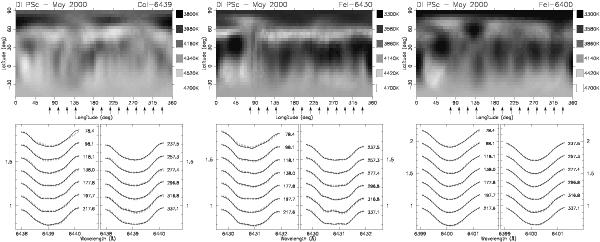
Reconstructed Doppler maps of DI Psc for Ca i 6439 Å, Fe i 6430 Å, and Fe i 6400 Å mapping lines. The maps are presented in a pseudo-Mercator projection from latitude − 50° to +90°. The phases of the observations are marked by arrows underneath. Below surface temperature reconstructions the fitted line profiles are shown, where small dashes represent the data points and measure the ± 1-σ errors.
Current usage metrics show cumulative count of Article Views (full-text article views including HTML views, PDF and ePub downloads, according to the available data) and Abstracts Views on Vision4Press platform.
Data correspond to usage on the plateform after 2015. The current usage metrics is available 48-96 hours after online publication and is updated daily on week days.
Initial download of the metrics may take a while.