Fig. 6
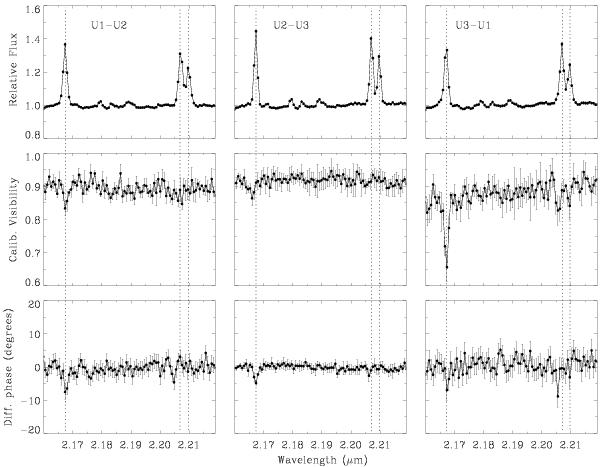
As Fig. 4, but for configuration C observations. These observations were taken with FINITO, resulting in a a larger wavelength coverage than the other configurations. We show the range containing the Brγ and Na i emission lines. Note that the drop in visibilities across line centre of the Na i lines is consistently smaller than for Brγ at all baselines, suggesting the emission comes from a smaller region. The various faint spectral features are the result of imperfect cancellation of absorption features in the spectrum of the standard star (see Fig. 3), this does not affect the visibility measurements.
Current usage metrics show cumulative count of Article Views (full-text article views including HTML views, PDF and ePub downloads, according to the available data) and Abstracts Views on Vision4Press platform.
Data correspond to usage on the plateform after 2015. The current usage metrics is available 48-96 hours after online publication and is updated daily on week days.
Initial download of the metrics may take a while.