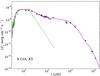
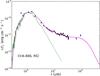
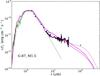
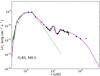
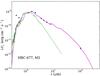
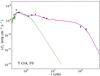
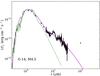
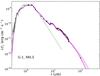
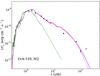
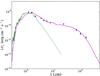
Fig. 12
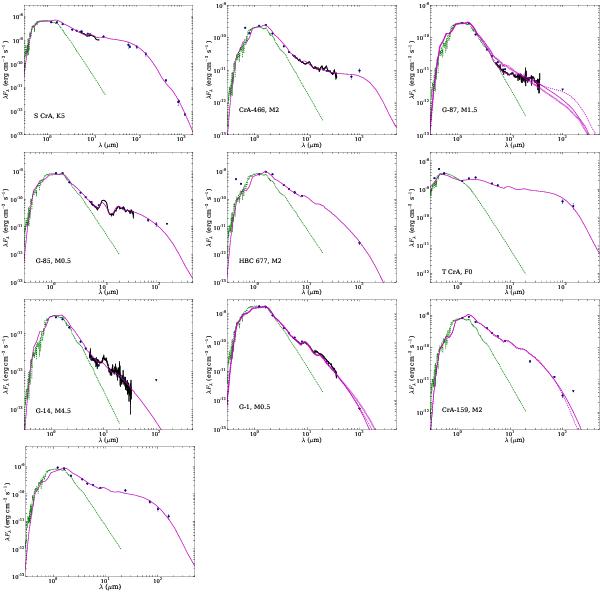
SEDs and disk models. Photometry detections are marked as circles, with upper limits marked as inverted triangles. The spectra correspond to Spitzer/IRS observations, when available. For comparison, a photospheric MARCS model (Gustafsson et al. 2008) with a similar spectral type is shown for each object (green dotted line). The disk models are shown as magenta bold lines (or also dotted and dashed lines, in the cases with more than one model). See text and Table 6 for a detailed discussion.
Current usage metrics show cumulative count of Article Views (full-text article views including HTML views, PDF and ePub downloads, according to the available data) and Abstracts Views on Vision4Press platform.
Data correspond to usage on the plateform after 2015. The current usage metrics is available 48-96 hours after online publication and is updated daily on week days.
Initial download of the metrics may take a while.