Free Access
Fig. 3
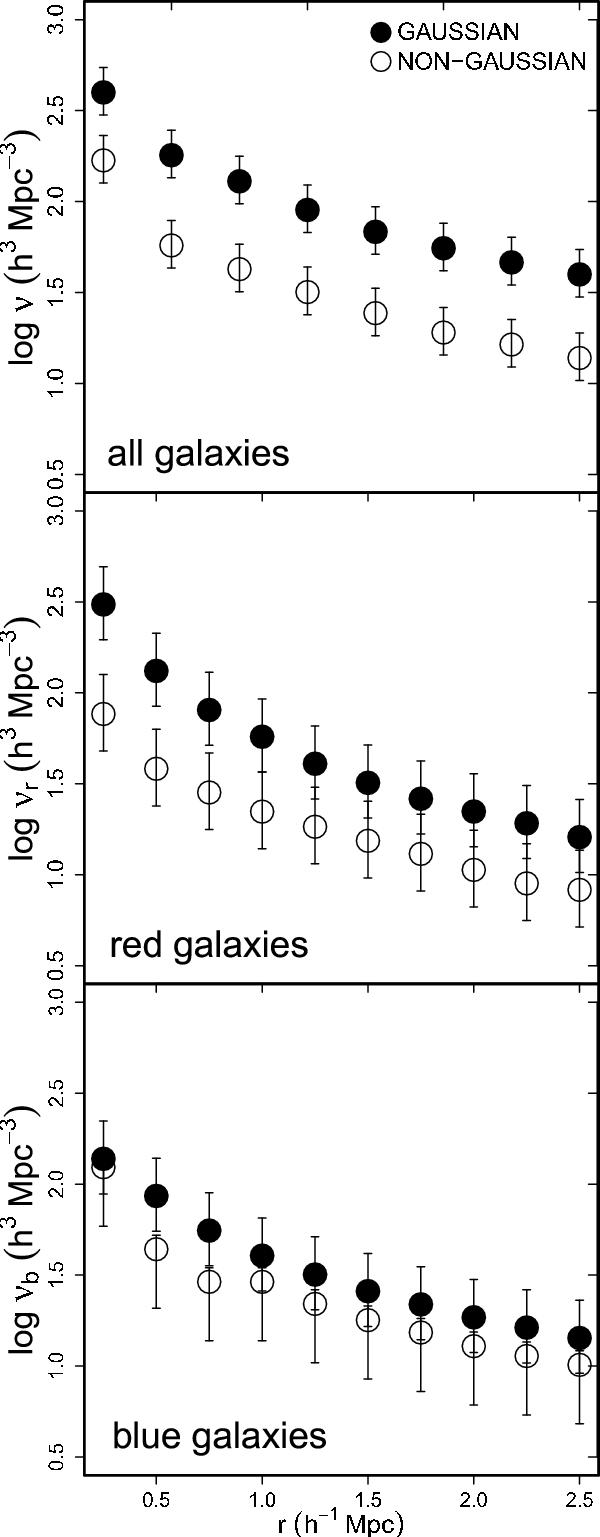
Galaxy number density profiles in redshift space. Filled and open circles denote G and NG systems, respectively. Error bars are obtained from 1000 bootstrap resamplings of galaxy groups. Top, middle and bottom plots refer to all, red, and blue galaxies, respectively.
Current usage metrics show cumulative count of Article Views (full-text article views including HTML views, PDF and ePub downloads, according to the available data) and Abstracts Views on Vision4Press platform.
Data correspond to usage on the plateform after 2015. The current usage metrics is available 48-96 hours after online publication and is updated daily on week days.
Initial download of the metrics may take a while.