Fig. 1
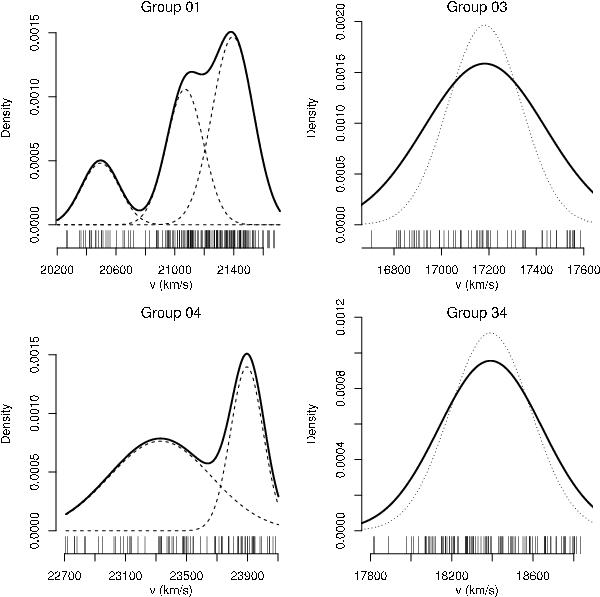
Four examples of multimodality diagnostics for groups in the UMaS region. Vertical bars depict individual galaxies in each group. The solid lines indicate the best Gaussian mixture for for radial velocities distributions in km s-1. The dashed lines show the individual components of the multimodal systems. The dotted lines indicate the average Gaussian curve for 1000 resamplings of groups 03 and 34, unimodal but non-Gaussian systems.
Current usage metrics show cumulative count of Article Views (full-text article views including HTML views, PDF and ePub downloads, according to the available data) and Abstracts Views on Vision4Press platform.
Data correspond to usage on the plateform after 2015. The current usage metrics is available 48-96 hours after online publication and is updated daily on week days.
Initial download of the metrics may take a while.