Fig. 7
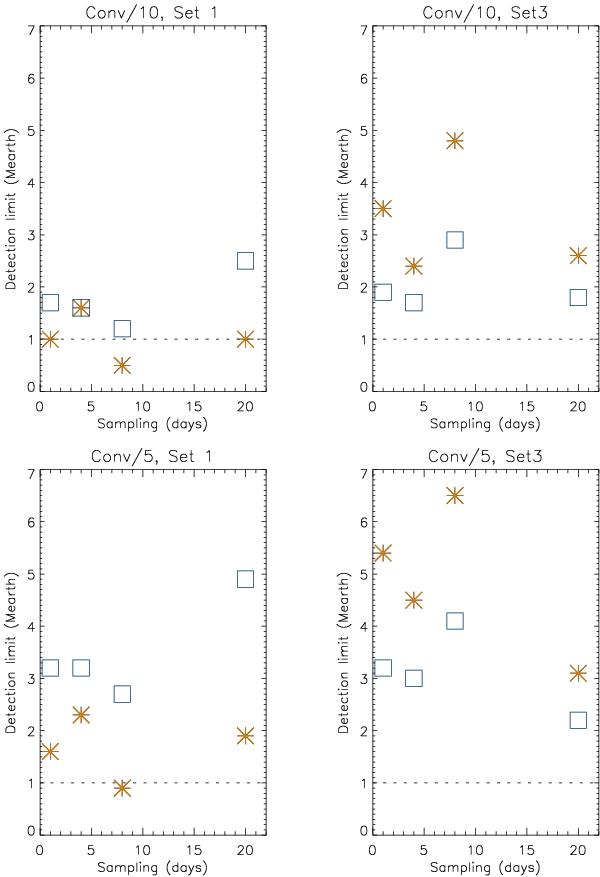
Upper left panel: detection limits versus sampling for a modified RVtot corresponding to a convection contribution ten times smaller than the solar one for Set 1. Detection limits are computed using the correlation-based method (stars, orange), and the LPA method (squares, blue). There is no noise level on the RV signal. Upper right panel: same for Set 3. Lower panels: same for a convection contribution five times smaller than the solar one.
Current usage metrics show cumulative count of Article Views (full-text article views including HTML views, PDF and ePub downloads, according to the available data) and Abstracts Views on Vision4Press platform.
Data correspond to usage on the plateform after 2015. The current usage metrics is available 48-96 hours after online publication and is updated daily on week days.
Initial download of the metrics may take a while.