Fig. 6
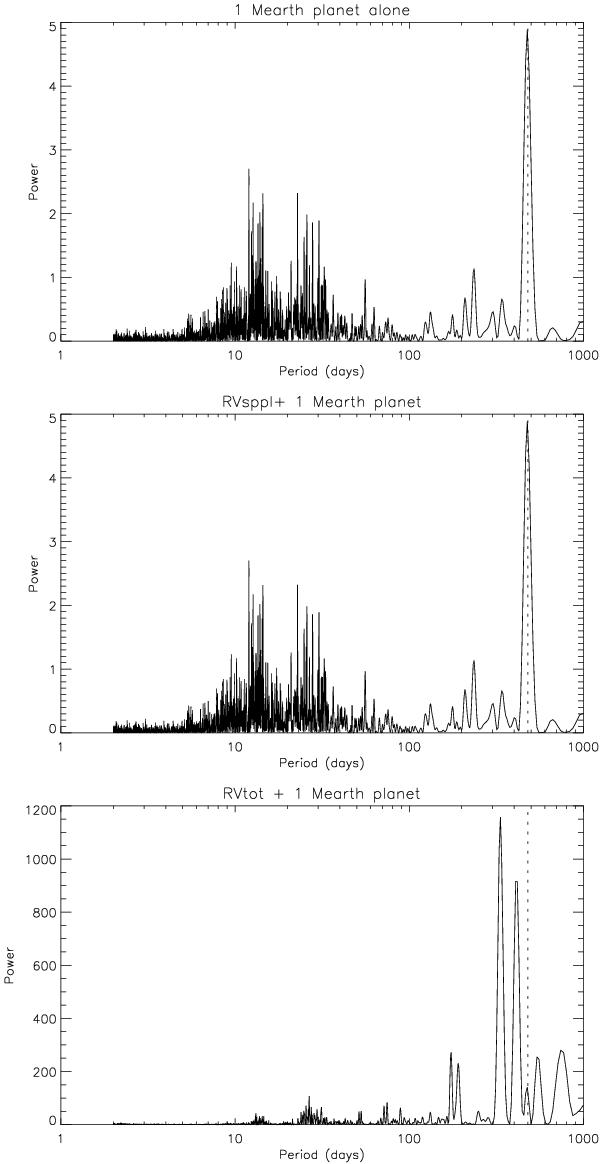
Upper panel: periodogram of a 1 MEarth at 1.2 AU with the Set 1 sampling (all days). The vertical dotted line indicates the position of the planet peak. Middle panel: same for the RVsppl added to the signal of this planet. Lower panel: same for the RVtot added to the signal of this planet. Power is in arbitrary unit but on the same scale on all plots.
Current usage metrics show cumulative count of Article Views (full-text article views including HTML views, PDF and ePub downloads, according to the available data) and Abstracts Views on Vision4Press platform.
Data correspond to usage on the plateform after 2015. The current usage metrics is available 48-96 hours after online publication and is updated daily on week days.
Initial download of the metrics may take a while.