Fig. 5
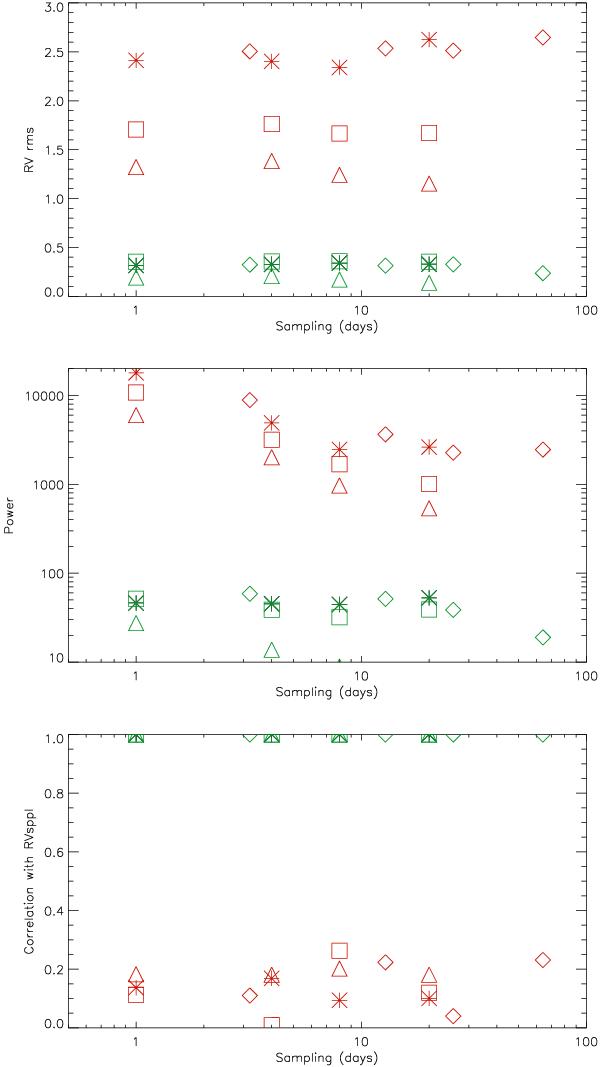
Upper panel: rms of the RV signal versus the sampling for zero RV noise, for the spots+plages RV signal (green), and for the total RV signal (red) for Set 1 (stars), Set 2 (diamonds), Set 3 (triangle), and Set 4 (squares). Middle panel: same for the total power computed from the periodogram. Lower panel: same for the correlation with the spots+plages RV signal corresponding to the same sampling.
Current usage metrics show cumulative count of Article Views (full-text article views including HTML views, PDF and ePub downloads, according to the available data) and Abstracts Views on Vision4Press platform.
Data correspond to usage on the plateform after 2015. The current usage metrics is available 48-96 hours after online publication and is updated daily on week days.
Initial download of the metrics may take a while.