Fig. 18
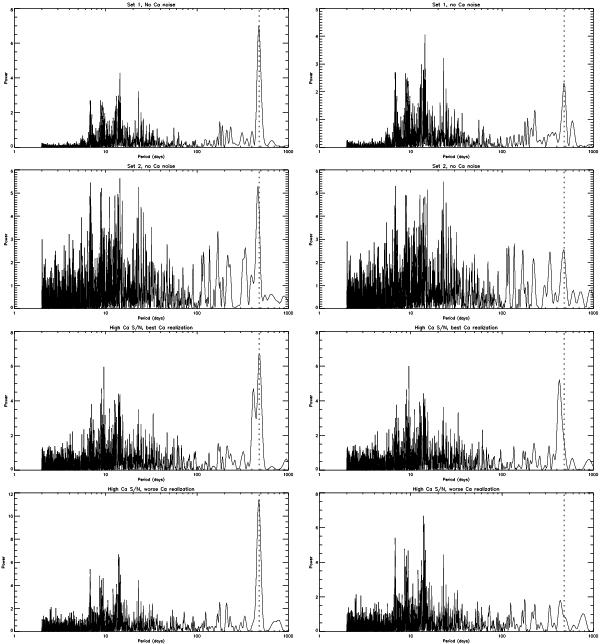
First row: periodogram of the total RV signal added to the RV signal due to a 1 MEarth at 1.2 AU after correction (method described in Sect. 4.2), with the Set 1 sampling (all days) and no Ca noise. The vertical dotted line indicates the position of the planet peak. The left panel shows the best detection case out of 7 planet phases, while the right panel shows the worse case. Second row: same for Set 2 and no Ca noise. Third row: same for Set 1, high Ca S/N, and a Ca realisation leading to a detection limit below 1 MEarth. Fourth row:same for Set 1, high Ca S/N, and a Ca realisation leading to a detection limit above 1 MEarth for the correlation method (1.6 MEarth). Power is in arbitrary unit but on the same scale on all plots.
Current usage metrics show cumulative count of Article Views (full-text article views including HTML views, PDF and ePub downloads, according to the available data) and Abstracts Views on Vision4Press platform.
Data correspond to usage on the plateform after 2015. The current usage metrics is available 48-96 hours after online publication and is updated daily on week days.
Initial download of the metrics may take a while.