Free Access
Fig. 17
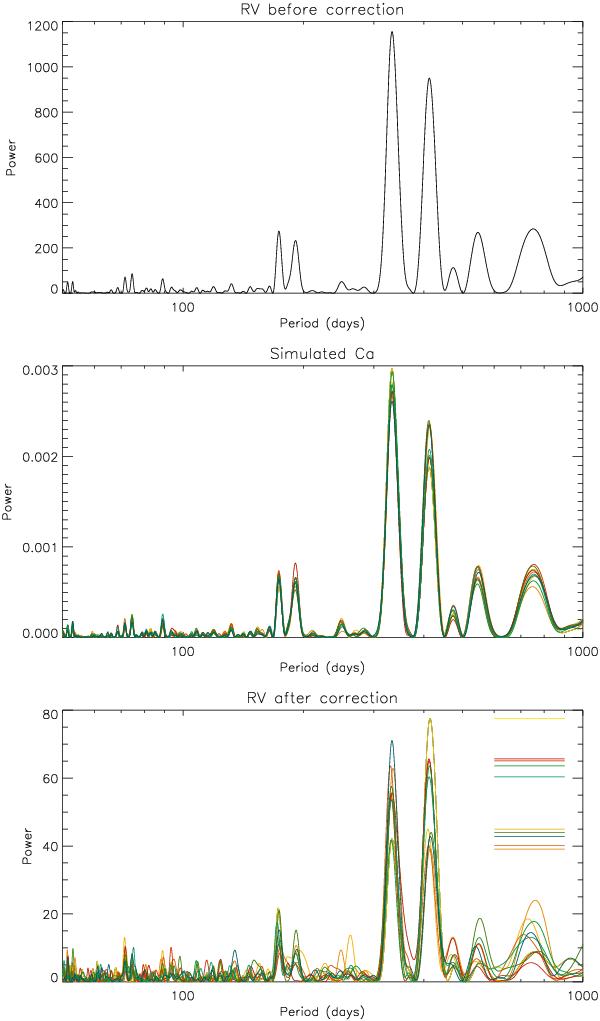
Upper panel: periodogram of the RV before correction for Set 1, best sampling. Middle panel: periodogram of the 10 Ca time series for that sampling and a medium Ca S/N. Lower panel: periodogram of the 10 RV series after correction. The horizontal lines on the right indicate the maximum power in the periodograms.
Current usage metrics show cumulative count of Article Views (full-text article views including HTML views, PDF and ePub downloads, according to the available data) and Abstracts Views on Vision4Press platform.
Data correspond to usage on the plateform after 2015. The current usage metrics is available 48-96 hours after online publication and is updated daily on week days.
Initial download of the metrics may take a while.