Fig. 15
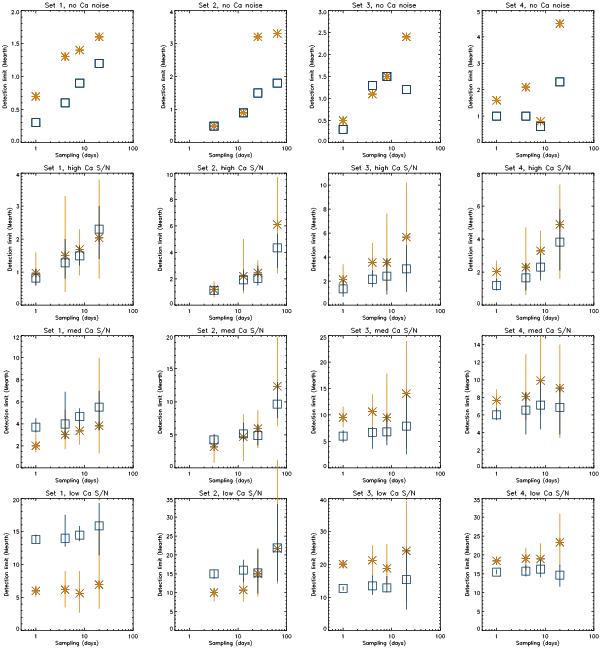
Detection limits versus sampling for the corrected signal using reconstructed Ca for the correlation-based method (stars, orange), and the LPA method (squares, blue). Each row corresponds to a different Ca noise level (from top to bottom: no noise, σhigh, σmed, σlow). Each column corresponds to a data set (from left to right: from Set 1 to Set 4). The errorbar symbols indicate the minimum value and maximum values for each detection limit, computed for ten realisations of the Ca noise.
Current usage metrics show cumulative count of Article Views (full-text article views including HTML views, PDF and ePub downloads, according to the available data) and Abstracts Views on Vision4Press platform.
Data correspond to usage on the plateform after 2015. The current usage metrics is available 48-96 hours after online publication and is updated daily on week days.
Initial download of the metrics may take a while.