Free Access
Fig. 10
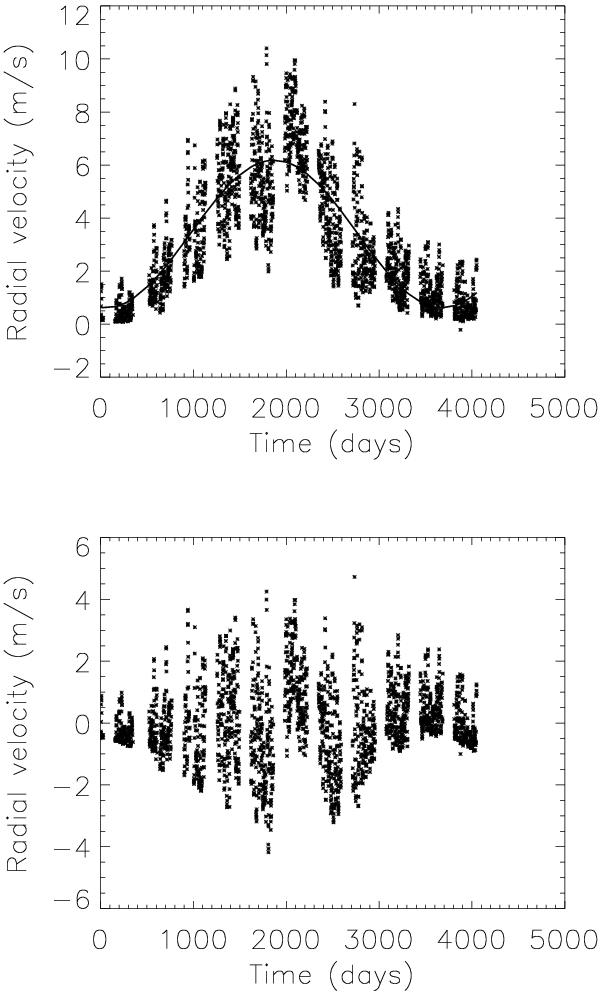
Upper panel: RVtot versus time for Set 1, best sampling. The solid line is the sinusoidal fit derived as described in Sect. 4.1. Lower panel: RV after correction using the sinusoidal fit method, assuming no Ca noise.
Current usage metrics show cumulative count of Article Views (full-text article views including HTML views, PDF and ePub downloads, according to the available data) and Abstracts Views on Vision4Press platform.
Data correspond to usage on the plateform after 2015. The current usage metrics is available 48-96 hours after online publication and is updated daily on week days.
Initial download of the metrics may take a while.