Fig. 5
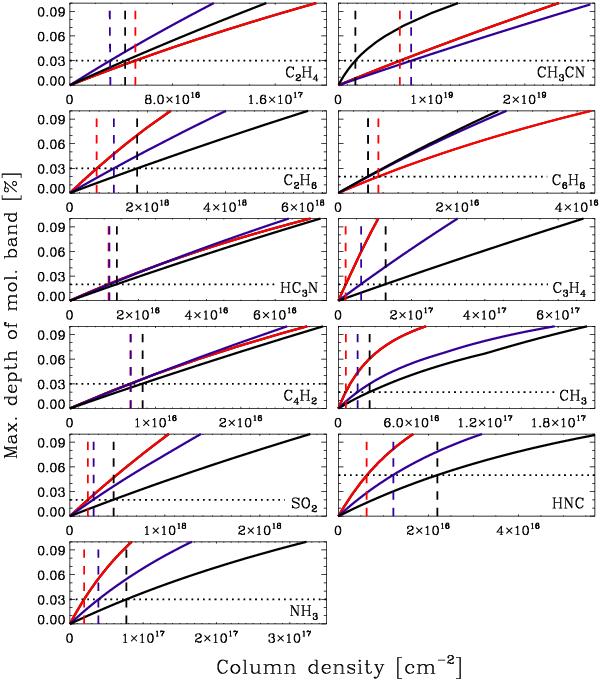
Variation of the maximum depth of the spectral features as a function of column density at excitation temperatures of 200 K (red), 500 K (blue) and 1000 K (black). The 3σ observational limit for IRS 46 is marked with a black dotted line and the colored dashed lines show the corresponding upper limits on the column densities for the three temperatures.
Current usage metrics show cumulative count of Article Views (full-text article views including HTML views, PDF and ePub downloads, according to the available data) and Abstracts Views on Vision4Press platform.
Data correspond to usage on the plateform after 2015. The current usage metrics is available 48-96 hours after online publication and is updated daily on week days.
Initial download of the metrics may take a while.