Fig. 9
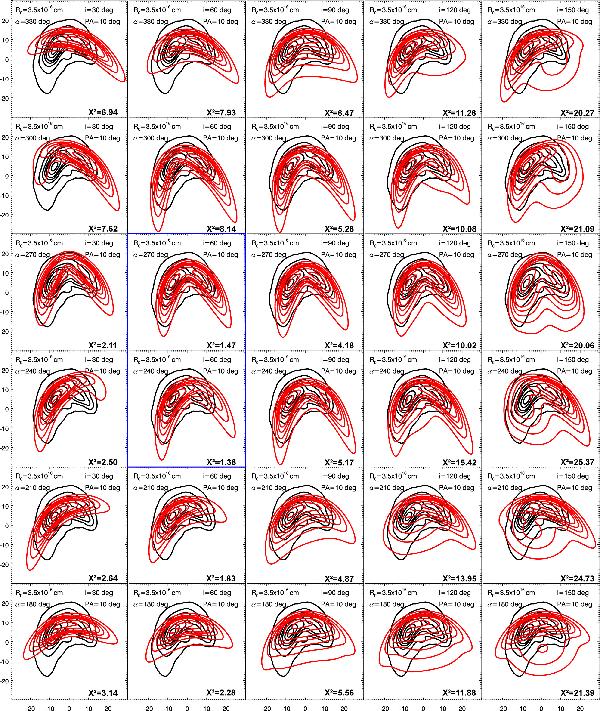
Bow shock models with corresponding χ2-values for six different rotation angles α under five different inclination angles i. All models were simulated for a constant stand-off distance R0 = 3.5 × 1016 cm with a constant position angle PA = 10°. Black lines represent intensity contours derived from L′-band images. Red lines correspond to simulated bow shock model intensity contours. The best-fitting plots are marked by the blue box. The axes of each model show the relative RA and Dec with respect to the central star in units of pixels, with one pixel corresponding to 0.027′′.
Current usage metrics show cumulative count of Article Views (full-text article views including HTML views, PDF and ePub downloads, according to the available data) and Abstracts Views on Vision4Press platform.
Data correspond to usage on the plateform after 2015. The current usage metrics is available 48-96 hours after online publication and is updated daily on week days.
Initial download of the metrics may take a while.