Free Access
Fig. A.1
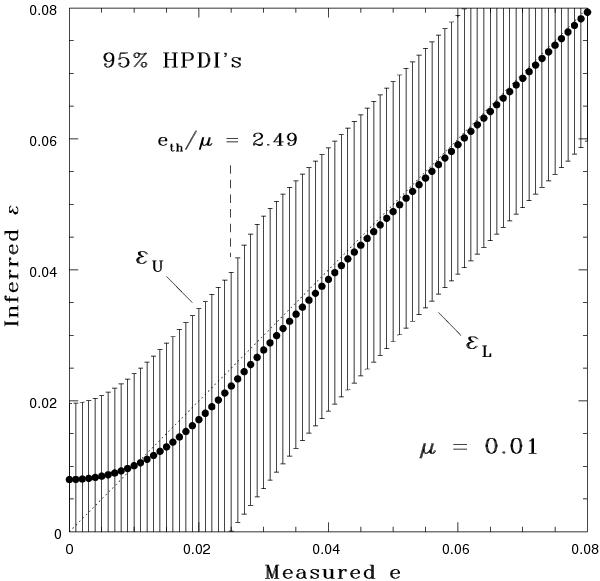
Highest posterior density intervals for the posterior pdf q(ε | e). The enclosed posterior probability of each HPDI is 95%, and the prior pdf ψ is given by Eq. (A.1). The filled circles are the posterior means ⟨ ε ⟩ computed from Eq. (12).
Current usage metrics show cumulative count of Article Views (full-text article views including HTML views, PDF and ePub downloads, according to the available data) and Abstracts Views on Vision4Press platform.
Data correspond to usage on the plateform after 2015. The current usage metrics is available 48-96 hours after online publication and is updated daily on week days.
Initial download of the metrics may take a while.