Fig. 4
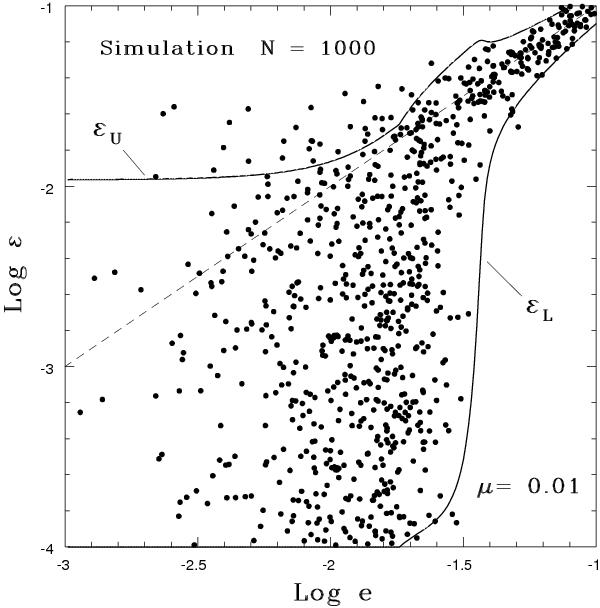
Ensemble simulation comprising N = 1000 SB1’s with the parameters of Sect. 3.1. The plotted points randomly sample the time interval (0,t∗), have true eccentricities ε from Eq. (8), and have Gaussian measurement errors added to derive e. The 95% HPDIs (εL,εU) are indicated. For e < eth = 0.018, the lower limit εL = ε∗ = 10-4.
Current usage metrics show cumulative count of Article Views (full-text article views including HTML views, PDF and ePub downloads, according to the available data) and Abstracts Views on Vision4Press platform.
Data correspond to usage on the plateform after 2015. The current usage metrics is available 48-96 hours after online publication and is updated daily on week days.
Initial download of the metrics may take a while.