Free Access
Fig. 1
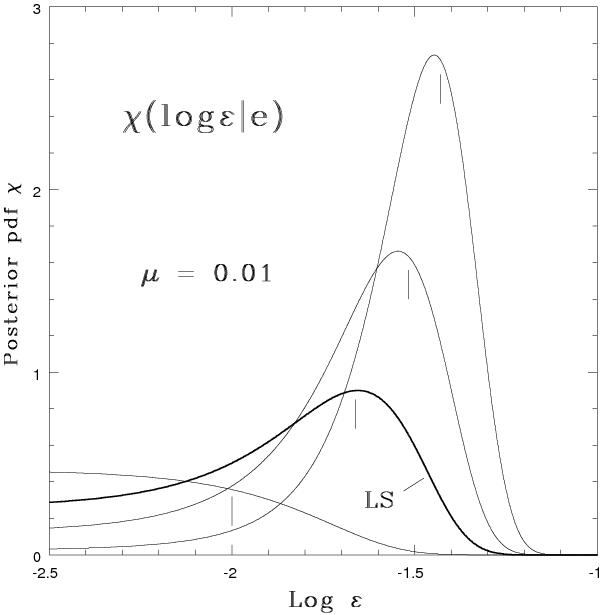
The pdf χ(log ε | e) for the values of e indicated by the vertical lines. These are at e/μ = 1.00,2.45,3.03 and 3.72, corresponding to levels of significance of 61, 5, 1, and 0.1%, respectively. The bold curve is the pdf at the point where the LS-test switches from accepting to rejecting a circular orbit.
Current usage metrics show cumulative count of Article Views (full-text article views including HTML views, PDF and ePub downloads, according to the available data) and Abstracts Views on Vision4Press platform.
Data correspond to usage on the plateform after 2015. The current usage metrics is available 48-96 hours after online publication and is updated daily on week days.
Initial download of the metrics may take a while.