Free Access
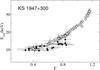
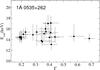
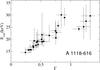
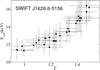
Fig. 7
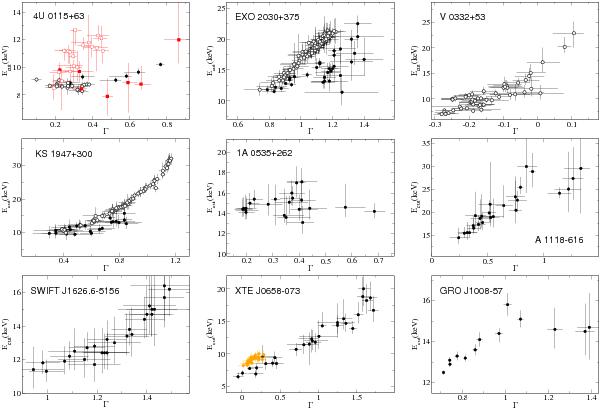
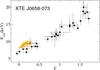
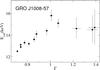
Cutoff energy as a function of the photon index. Open circles represent the DB, filled circles the HB. Orange data points in XTE J0658–073 correspond to the peak of the outburst. In 4U 0115+63, red squares represent the results from the “bump” model.
This figure is made of several images, please see below:
Current usage metrics show cumulative count of Article Views (full-text article views including HTML views, PDF and ePub downloads, according to the available data) and Abstracts Views on Vision4Press platform.
Data correspond to usage on the plateform after 2015. The current usage metrics is available 48-96 hours after online publication and is updated daily on week days.
Initial download of the metrics may take a while.