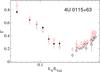
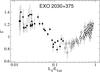
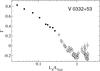
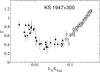
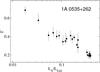
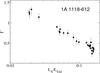
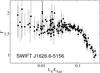
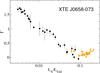
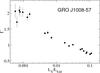
Fig. 6
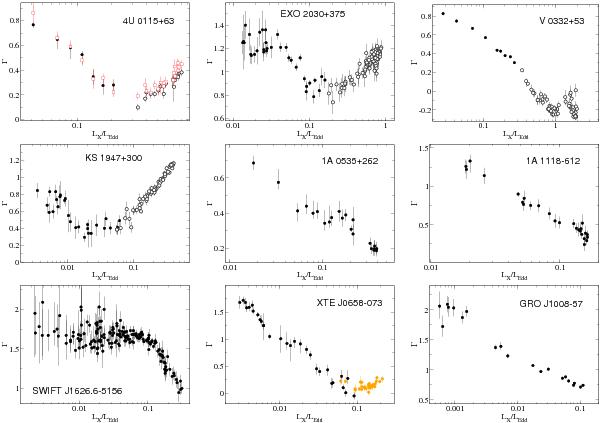
Power-law photon index as a function of X-ray luminosity. Open circles represent the DB (supercritical regime), filled circles the HB (subcritical regime). Orange data points in XTE J0658–073 correspond to the flaring episode during the peak of the outburst (see Fig. 1). In 4U 0115+63, red squares represent the results from the “bump” model (see text). The Eddington luminosity for a neutron star was taken to be 1.7 × 1038 erg s-1.
Current usage metrics show cumulative count of Article Views (full-text article views including HTML views, PDF and ePub downloads, according to the available data) and Abstracts Views on Vision4Press platform.
Data correspond to usage on the plateform after 2015. The current usage metrics is available 48-96 hours after online publication and is updated daily on week days.
Initial download of the metrics may take a while.