Free Access
Fig. 5
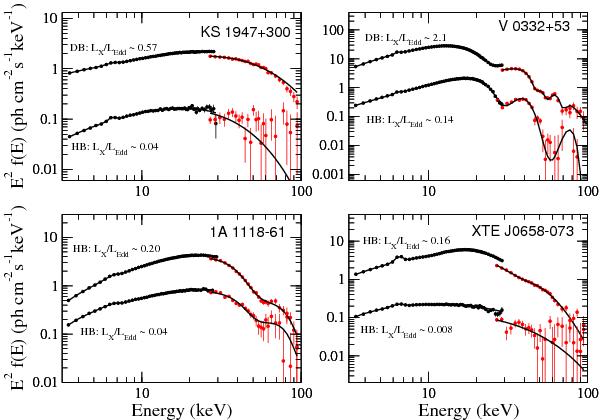
Average energy spectra of the horizontal and diagonal branches at various flux levels. Black and red symbols represent PCA and HEXTE data, respectively. The quoted X-ray luminosity corresponds to the 2–100 keV range.
Current usage metrics show cumulative count of Article Views (full-text article views including HTML views, PDF and ePub downloads, according to the available data) and Abstracts Views on Vision4Press platform.
Data correspond to usage on the plateform after 2015. The current usage metrics is available 48-96 hours after online publication and is updated daily on week days.
Initial download of the metrics may take a while.