Free Access
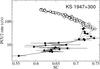
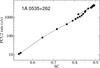
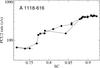
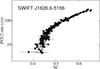
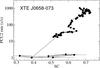
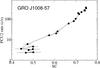
Fig. 3
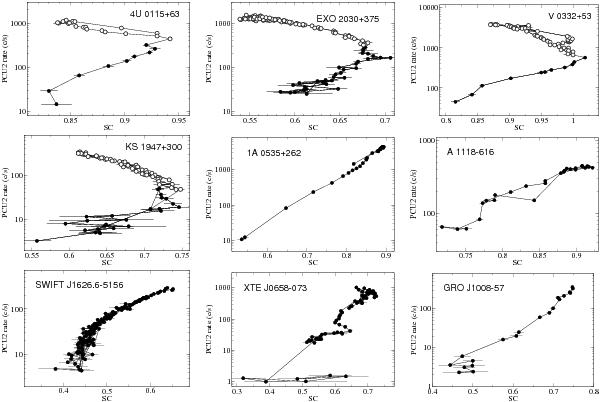
Hardness (soft colour)-intensity diagram. The soft colour was defined as the ratio 7–10 keV / 4–7 keV. The count rate was obtained for the 4–30 keV energy band. Open circles designate points in the DB, while filled circles correspond to the HB. A logarithmic scale is used for the count rate (confront with Fig. 2).
This figure is made of several images, please see below:
Current usage metrics show cumulative count of Article Views (full-text article views including HTML views, PDF and ePub downloads, according to the available data) and Abstracts Views on Vision4Press platform.
Data correspond to usage on the plateform after 2015. The current usage metrics is available 48-96 hours after online publication and is updated daily on week days.
Initial download of the metrics may take a while.