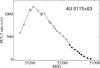
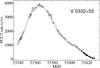
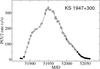
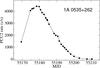
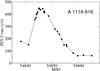
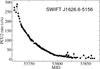
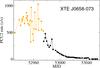
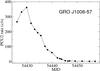
Fig. 1
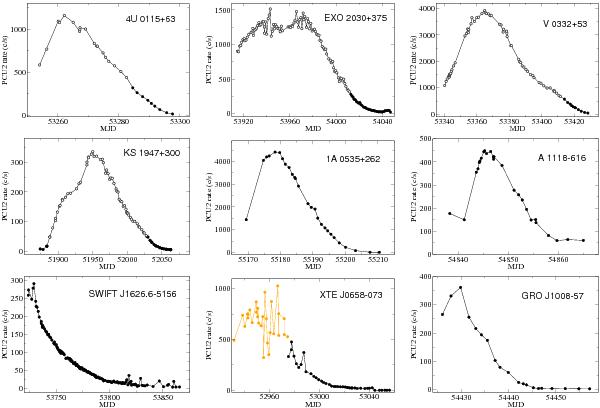
Outburst profiles as seen by RXTE/PCA. Each point represents the average over an observation interval (typically 1000–3000 s). The count rate was obtained using the PCU2 in the energy band 4–30 keV. Different symbols denote different source states: open circles represent the diagonal branch (DB), while filled circles correspond to the horizontal branch (HB). The flaring activity during the peak of the outburst in XTE J0658–073 was analysed separately from the smoother decay.
Current usage metrics show cumulative count of Article Views (full-text article views including HTML views, PDF and ePub downloads, according to the available data) and Abstracts Views on Vision4Press platform.
Data correspond to usage on the plateform after 2015. The current usage metrics is available 48-96 hours after online publication and is updated daily on week days.
Initial download of the metrics may take a while.