Fig. 6
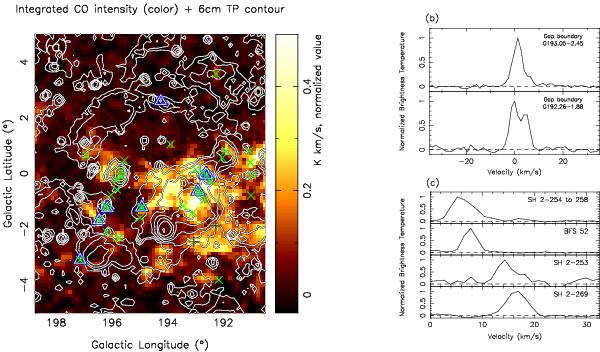
Left panel: CO intensity map integrated from 0.0 to 32.5 km s-1, overlaid by the λ6 cm total intensity contours as shown in Fig. 1. Each pixel value was normalized by dividing by the maximum integrated intensity in the image. The green crosses represent the proto-stellar candidates selected from the IRAS point source catalogue by the criteria introduced by Junkes et al. (1992), while the blue-white triangles are the massive young stellar objects found in the Red MSX survey. Top right panel: normalized CO emission profile for the two areas marked with the black “plus” in the left panel. Bottom right panel: CO spectra for the H II regions SH 2-254 to 258, BFS 52, SH 2-253, and SH 2-269. The brightness temperature in each region was also normalized.
Current usage metrics show cumulative count of Article Views (full-text article views including HTML views, PDF and ePub downloads, according to the available data) and Abstracts Views on Vision4Press platform.
Data correspond to usage on the plateform after 2015. The current usage metrics is available 48-96 hours after online publication and is updated daily on week days.
Initial download of the metrics may take a while.