Free Access
Fig. 5
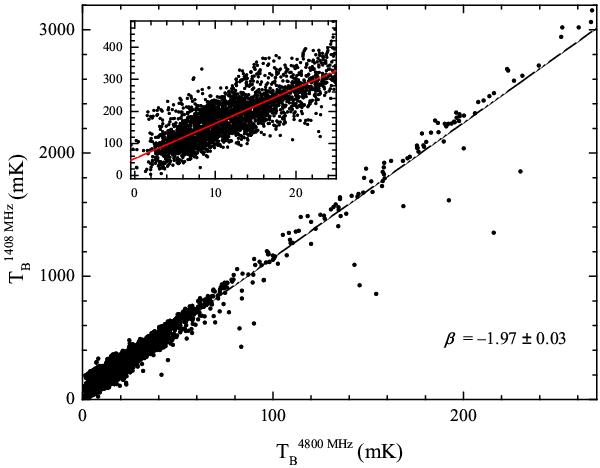
TT-plot for the southern part of the Origem Loop between λ6 cm and
λ21 cm. The inner small image is the zoom-in picture for the
value  mK
Tb. The red line in the small image represents the
same spectral index as in the large image.
mK
Tb. The red line in the small image represents the
same spectral index as in the large image.
Current usage metrics show cumulative count of Article Views (full-text article views including HTML views, PDF and ePub downloads, according to the available data) and Abstracts Views on Vision4Press platform.
Data correspond to usage on the plateform after 2015. The current usage metrics is available 48-96 hours after online publication and is updated daily on week days.
Initial download of the metrics may take a while.