Fig. 4
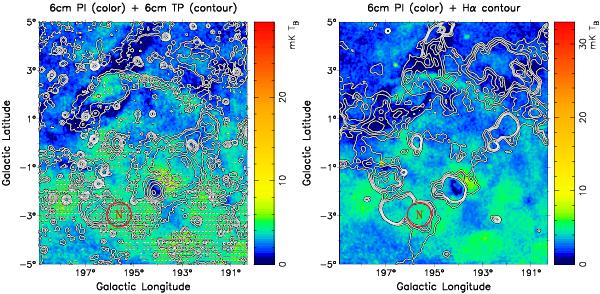
left panel: λ6 cm polarization image
(9 5
resolution) of the Origem Loop region superimposed with total intensity contours and
polarization vector
B = E + 90°.
right panel: λ6 cm polarization image overlaid
with the Hα intensity (6′ resolution) contours. Red circles with
“N” inside in both images indicate a probable new H II region, see detail
in the text.
5
resolution) of the Origem Loop region superimposed with total intensity contours and
polarization vector
B = E + 90°.
right panel: λ6 cm polarization image overlaid
with the Hα intensity (6′ resolution) contours. Red circles with
“N” inside in both images indicate a probable new H II region, see detail
in the text.
Current usage metrics show cumulative count of Article Views (full-text article views including HTML views, PDF and ePub downloads, according to the available data) and Abstracts Views on Vision4Press platform.
Data correspond to usage on the plateform after 2015. The current usage metrics is available 48-96 hours after online publication and is updated daily on week days.
Initial download of the metrics may take a while.