Free Access
Fig. 3
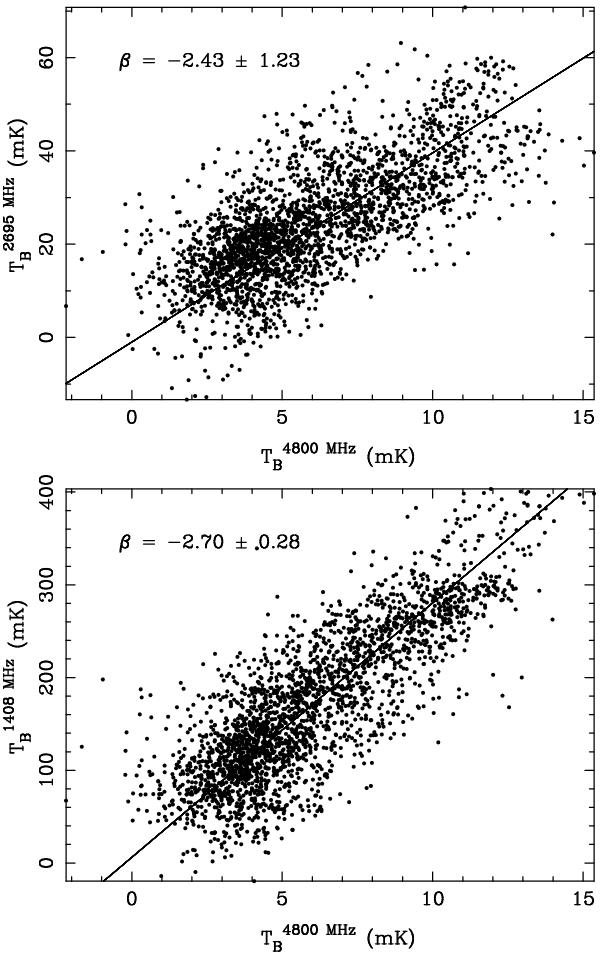
TT-plot for all the pixels in the Origem Arc region (outlined by the black dashed line in Fig. 2) between λ6 cm and λ11 cm (upper panel) and between λ6 cm and λ21 cm (bottom panel).
This figure is made of several images, please see below:
Current usage metrics show cumulative count of Article Views (full-text article views including HTML views, PDF and ePub downloads, according to the available data) and Abstracts Views on Vision4Press platform.
Data correspond to usage on the plateform after 2015. The current usage metrics is available 48-96 hours after online publication and is updated daily on week days.
Initial download of the metrics may take a while.