Fig. 2
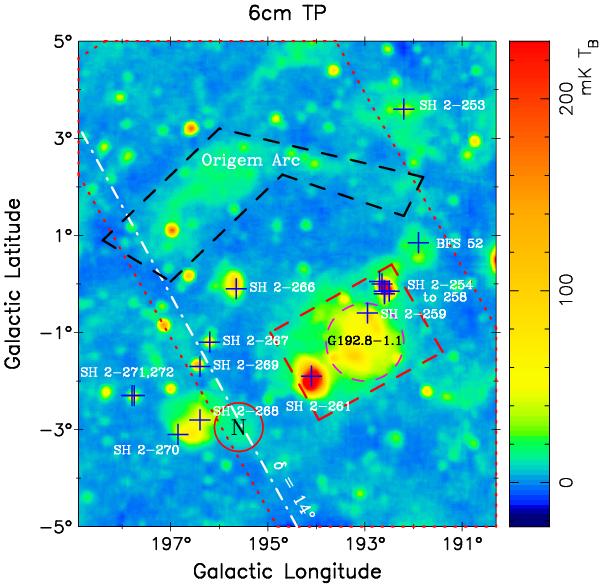
λ6 cm total intensity image with the prominent H II regions marked with “ + ” and labelled with the names. The disproved SNR, G192.8−1.1, was also marked with a circle of the pink dashed line. The outer red dotted line delineates the common area of the observations by Krymkin & Sidorchuk (1988) and our image, while the red dashed line indicates the field shown in Caswell (1985). The white dashed-dot line shows the declination of δ = 14° (Epoch 1950). The region on the left side of this line was not included in the 178 MHz map used by Berkhuijsen (1974). The area outlined by the black dashed line, containing the Origem Arc, was used for the TT-plot in Sect. 3.1. A probable new H II region G195.60-2.95 is marked using a circle with the letter “N” inside.
Current usage metrics show cumulative count of Article Views (full-text article views including HTML views, PDF and ePub downloads, according to the available data) and Abstracts Views on Vision4Press platform.
Data correspond to usage on the plateform after 2015. The current usage metrics is available 48-96 hours after online publication and is updated daily on week days.
Initial download of the metrics may take a while.