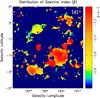
Fig. 1
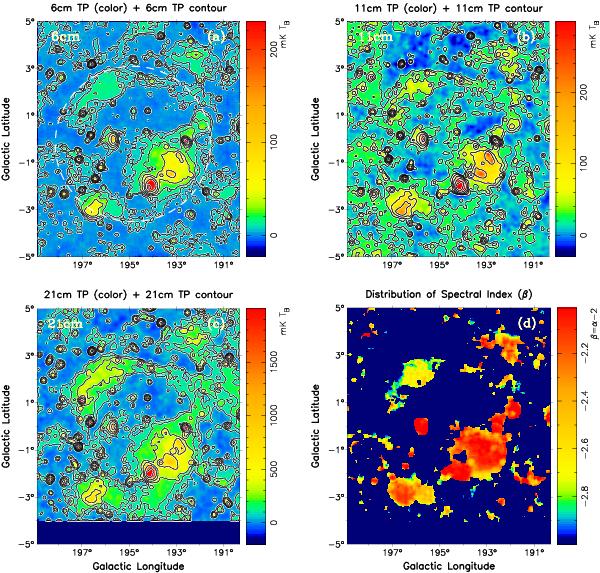
From top left a), top right b)
to bottom left panel c): λ6 cm,
λ11 cm, and the λ21 cm total intensity images of
the Origem Loop. The angular resolutions are 9 5,
95, and
94,
respectively. The contours run from
2n × 3.6 (3σ) mK TB,
(n = 0, 1, 2 ...) for the λ6 cm image,
2n × 18.0 (3σ) mK TB,
(n = 0, 1, 2 ...) for the λ11 cm image, and
2n × 66.0 (3σ) mK TB,
(n = 0, 1, 2 ...) for the λ21 cm image. The white
circle in the top left panel a) indicates the boundary
of the Origem Loop. Bottom right panel d): spectral
index distribution for the Origem Loop area derived from the Urumqi
λ6 cm, Effelsberg λ11 cm, and
λ21 cm images at the same angular resolution of
9
5.
5,
95, and
94,
respectively. The contours run from
2n × 3.6 (3σ) mK TB,
(n = 0, 1, 2 ...) for the λ6 cm image,
2n × 18.0 (3σ) mK TB,
(n = 0, 1, 2 ...) for the λ11 cm image, and
2n × 66.0 (3σ) mK TB,
(n = 0, 1, 2 ...) for the λ21 cm image. The white
circle in the top left panel a) indicates the boundary
of the Origem Loop. Bottom right panel d): spectral
index distribution for the Origem Loop area derived from the Urumqi
λ6 cm, Effelsberg λ11 cm, and
λ21 cm images at the same angular resolution of
9
5.
Current usage metrics show cumulative count of Article Views (full-text article views including HTML views, PDF and ePub downloads, according to the available data) and Abstracts Views on Vision4Press platform.
Data correspond to usage on the plateform after 2015. The current usage metrics is available 48-96 hours after online publication and is updated daily on week days.
Initial download of the metrics may take a while.