Fig. 2
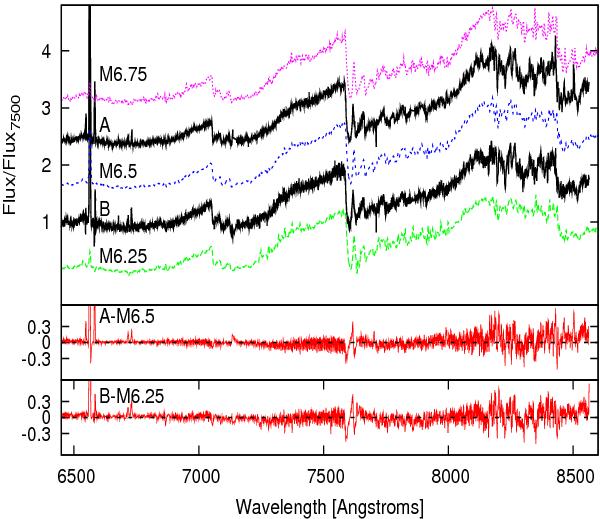
Comparison of the GMOS spectra of CHS 7797 at the two observed phases, i.e. maximum (A) and four days before maximum (B) with Upper Scorpius members spectra from Lodieu et al. (2011). The spectra were normalised using the flux at 7500 Å and displaced vertically by an arbitrary constant value. The bottom panel shows the subtraction of the spectra of CHS 7797 at each phase with the best-matched spectra of the UpS members.
Current usage metrics show cumulative count of Article Views (full-text article views including HTML views, PDF and ePub downloads, according to the available data) and Abstracts Views on Vision4Press platform.
Data correspond to usage on the plateform after 2015. The current usage metrics is available 48-96 hours after online publication and is updated daily on week days.
Initial download of the metrics may take a while.