Fig. 8
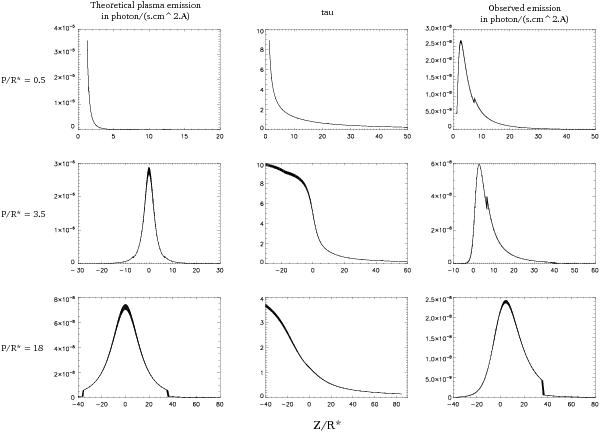
Line formation region of the O vii resonance line. The left panels yield the variation of the intrinsic emission per solid angle (emissivity multiplied by the density squared) along the z axis of the (p,z) coordinates for different values of the impact parameter p. The middle panels provide the optical depth τ along the line of sight to the observer (located at z → ∞). The right panels yield the contribution to the observable emission, i.e. the product of the intrinsic emission per solid angle with exp(−τ). The morphology of this distribution results from the combination of the two plasma components at 0.10 and 0.20 keV that extend between 7.5 and 85 R∗ for the former and 1.5 and 38 R∗ for the latter.
Current usage metrics show cumulative count of Article Views (full-text article views including HTML views, PDF and ePub downloads, according to the available data) and Abstracts Views on Vision4Press platform.
Data correspond to usage on the plateform after 2015. The current usage metrics is available 48-96 hours after online publication and is updated daily on week days.
Initial download of the metrics may take a while.