Fig. 3
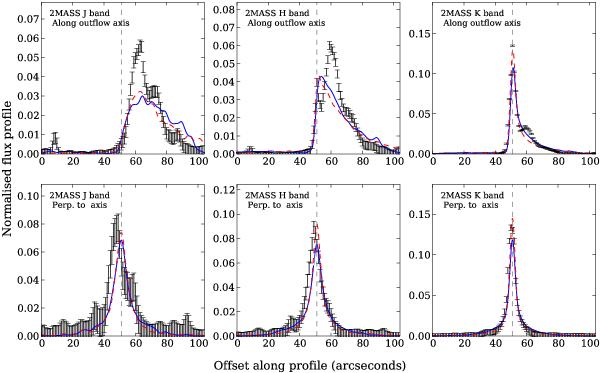
Black error bars: normalised flux profiles for the three 2MASS bands, aligned with (top) and perpendicular to (bottom) the outflow axis. Blue and red lines: the profiles of the best-fitting models to both the observed SED and profiles, for envelope with disk and without disk models respectively. Vertical grey dashed lines mark the position of the central source.
Current usage metrics show cumulative count of Article Views (full-text article views including HTML views, PDF and ePub downloads, according to the available data) and Abstracts Views on Vision4Press platform.
Data correspond to usage on the plateform after 2015. The current usage metrics is available 48-96 hours after online publication and is updated daily on week days.
Initial download of the metrics may take a while.