Fig. 15
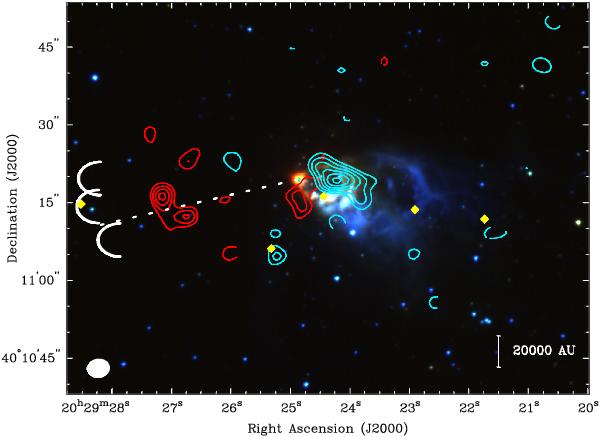
Gemini North three-colour JHK′ image of AFGL 2591 overlaid with contours of C18O emission integrated over –4.3 to −3.3 km s-1 (red) and –8.0 to –7.0 km s-1 (blue). The three arcs in the east of the image show the positions of bow shocks visible in the Gemini North image, which are too faint to be seen directly in the figure. The dashed line shows the direction of the ionized jet observed at 3.6 cm (PA 100°), and yellow diamonds show roughly the peak positions of the H2 knots observed in Tamura & Yamashita (1992). Red-shifted contours are –3, 3, 4, 5, 6 × 0.1 Jy beam-1 km s-1 and blue-shifted contours are –3, 3, 4, 5, 6, 7 × 0.1 Jy beam-1 km s-1. The synthesised beam is shown in the lower left-hand corner (4.5′′ × 3.6′′, PA 93°). Near-IR image stretch as in Fig. 7.
Current usage metrics show cumulative count of Article Views (full-text article views including HTML views, PDF and ePub downloads, according to the available data) and Abstracts Views on Vision4Press platform.
Data correspond to usage on the plateform after 2015. The current usage metrics is available 48-96 hours after online publication and is updated daily on week days.
Initial download of the metrics may take a while.