Fig. 14
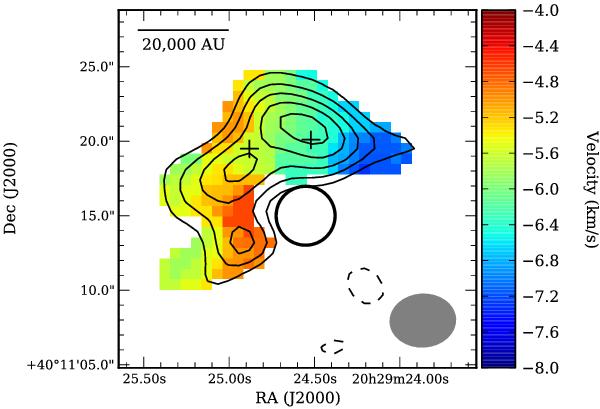
Shown in colour-scale: intensity-weighted first moment map of the C18O emission towards AFGL 2591. The corresponding velocities are shown on the colour-bar on the right. The black open circle represents the position and size of VLA 1 at 3.6 cm. The crosses indicate the position of VLA 2 and VLA 3. A scale size of 20 000 AU is represented by a bar in the upper left-hand corner. Shown in contours: the C18O integrated intensity map from –2.3 to –8.7 km s-1. The peak flux of the integrated intensity map is 2.5 Jy beam-1 km s-1. Contours are at –3, 3, 4, 5, 6, 7 × σ = 0.33 Jy beam-1 km s-1. The synthesised beam is shown in the lower right-hand corner (4.5′′ × 3.6′′, PA 93°). The rest velocity of the cloud is –5.7 km s-1.
Current usage metrics show cumulative count of Article Views (full-text article views including HTML views, PDF and ePub downloads, according to the available data) and Abstracts Views on Vision4Press platform.
Data correspond to usage on the plateform after 2015. The current usage metrics is available 48-96 hours after online publication and is updated daily on week days.
Initial download of the metrics may take a while.