Fig. 13
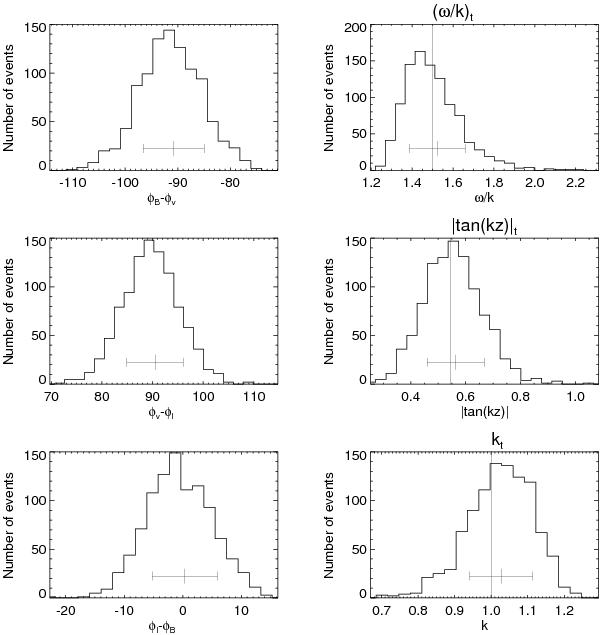
Results of the Fourier analysis on artificial data obtained by simulating a fast standing wave mode. The left histograms show the phase differences between perturbations in the LOS magnetic field, the LOS velocity, and the intensity. The right histograms show the phase speed ω/k, the value tan(kz), and the vertical wave number k which were calculated from the inverted amplitude ratios assuming q = 0.05.
Current usage metrics show cumulative count of Article Views (full-text article views including HTML views, PDF and ePub downloads, according to the available data) and Abstracts Views on Vision4Press platform.
Data correspond to usage on the plateform after 2015. The current usage metrics is available 48-96 hours after online publication and is updated daily on week days.
Initial download of the metrics may take a while.