Fig. 3
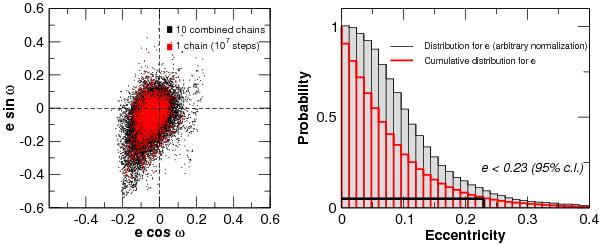
Left: distribution of MCMC states for the derived quantities ecosω and esinω as obtained from 1 MC chain of 107 steps (red) and the combination of 10 chains of 107 steps each (black). Only 1% of the steps are included in this plot to improve visualization. Right: marginalized probability distribution of the eccentricity is shown in black (arbitrary normalization). The corresponding cumulative distribution (red histogram) shows that eccentricities higher than 0.23 are ruled out at a 95% confidence level.
Current usage metrics show cumulative count of Article Views (full-text article views including HTML views, PDF and ePub downloads, according to the available data) and Abstracts Views on Vision4Press platform.
Data correspond to usage on the plateform after 2015. The current usage metrics is available 48-96 hours after online publication and is updated daily on week days.
Initial download of the metrics may take a while.