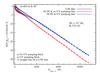
Fig. 19
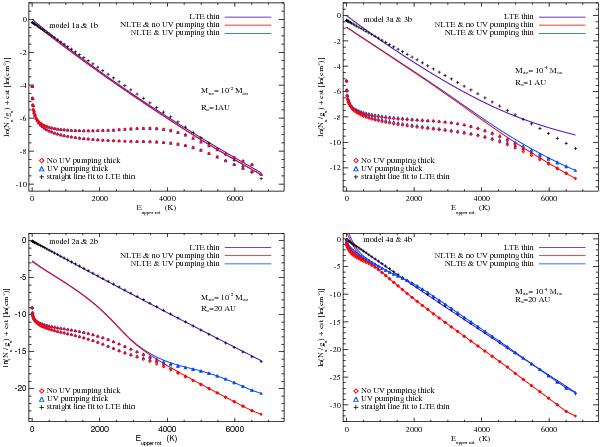
Disc model CO v = 1 population diagrams: LTE and NLTE with and without UV pumping in the optically thin case (solid lines) and optically thick case (symbols). All the data have been normalized to the J = 0 population in LTE. The blue diamonds correspond to the column densities after line transfer in models with UV pumping whereas the red triangles correspond to column densities in line-transfer model results without UV pumping. The LTE populations are fitted by straight lines (black plus signs). The separations between P- and R-branches are clearly seen in the NLTE optically thick cases.
Current usage metrics show cumulative count of Article Views (full-text article views including HTML views, PDF and ePub downloads, according to the available data) and Abstracts Views on Vision4Press platform.
Data correspond to usage on the plateform after 2015. The current usage metrics is available 48-96 hours after online publication and is updated daily on week days.
Initial download of the metrics may take a while.