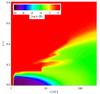
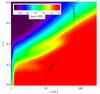
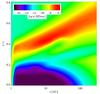
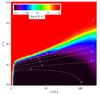
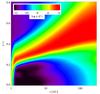
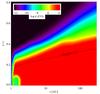
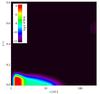
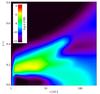
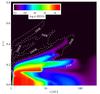
Fig. 11
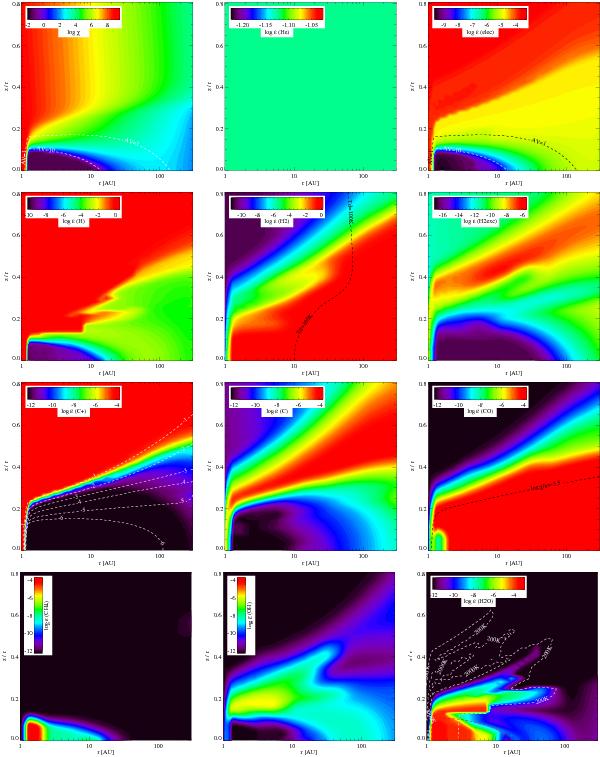
Model 1a χ structures and abundances relative to H-nuclei for atomic He, electron, H, H2, H2exc (v > 0), C+, C, CO, CH4, OH, and H2O. The contour plots in the ionized carbon abundance plot show log (χ/n), where χ is the enhancement with respect to the interstellar UV and n the total number of H-nuclei. In a few panels, dust temperature (Td), gas temperature (water abundance panel), or extinction AV contours are overplotted by dashed lines.
Current usage metrics show cumulative count of Article Views (full-text article views including HTML views, PDF and ePub downloads, according to the available data) and Abstracts Views on Vision4Press platform.
Data correspond to usage on the plateform after 2015. The current usage metrics is available 48-96 hours after online publication and is updated daily on week days.
Initial download of the metrics may take a while.