Fig. 5
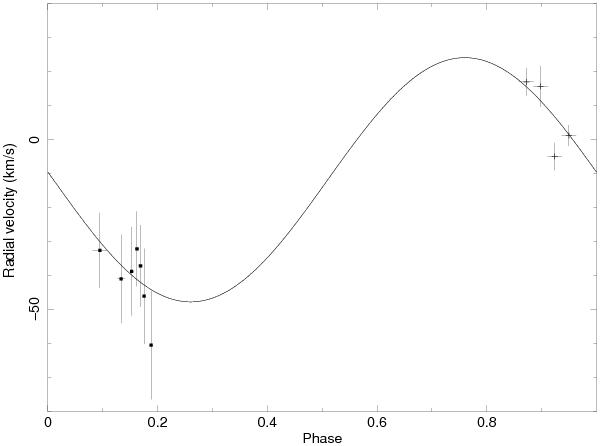
Radial velocities and errors of the Hα line in the optical spectrum of CV1. The solid line shows the best sinusoidal fit to these data. The points shown with filled squares are the radial velocity measurements made with the red spectra. The remaining four data points are the radial velocity measurements made with the blue spectra.
Current usage metrics show cumulative count of Article Views (full-text article views including HTML views, PDF and ePub downloads, according to the available data) and Abstracts Views on Vision4Press platform.
Data correspond to usage on the plateform after 2015. The current usage metrics is available 48-96 hours after online publication and is updated daily on week days.
Initial download of the metrics may take a while.