Fig. 7
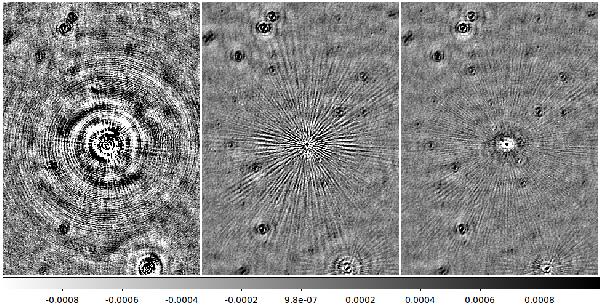
The performance of SAGECal with different solution intervals. The image on the left is without multi-directional calibration. The image in the middle is after running SAGECal with a solution interval of 20 min. The image on the right is after running SAGECal with a hybrid solution interval, where solutions are obtained along bright source clusters at every 5 min and for fainter source clusters, every 20 min. It is clear that the small scale ionospheric errors present in the middle figure are mostly eliminated in the right panel. However, ionospheric variations due to decorrelation effects within the 5 min interval are still present on the right panel. The colourbar (bottom) units are in Jy/PSF.
Current usage metrics show cumulative count of Article Views (full-text article views including HTML views, PDF and ePub downloads, according to the available data) and Abstracts Views on Vision4Press platform.
Data correspond to usage on the plateform after 2015. The current usage metrics is available 48-96 hours after online publication and is updated daily on week days.
Initial download of the metrics may take a while.