Fig. 6
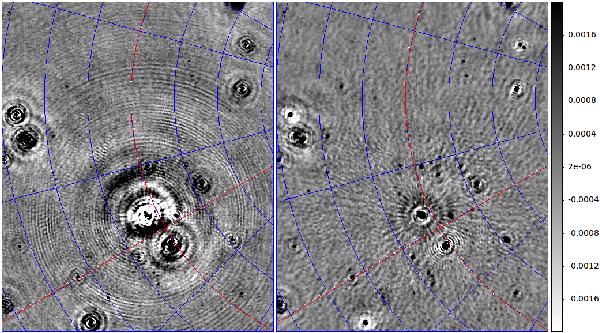
An area (about 0.5 deg × 0.5 deg) close to the NCP before and after multi-directional calibration using SAGECal. The image on the left is before running SAGECal and after a deep CLEAN deconvolution and errors due to beam variation and (some) ionospheric variations are clearly visible. On the right hand image, the sources are subtracted directly from the visibility data and the sky model is restored onto the residual image. Most of these errors visible in the left hand image are eliminated in the right hand image as CLEAN based deconvolution fails to consider the directional errors into account. The peak flux is 5 Jy/PSF and the colourbar units are in Jy/PSF.
Current usage metrics show cumulative count of Article Views (full-text article views including HTML views, PDF and ePub downloads, according to the available data) and Abstracts Views on Vision4Press platform.
Data correspond to usage on the plateform after 2015. The current usage metrics is available 48-96 hours after online publication and is updated daily on week days.
Initial download of the metrics may take a while.