Fig. 5
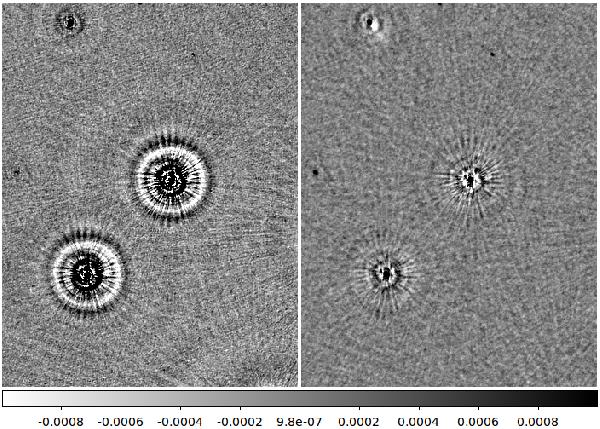
Clustering of two sources 5′ apart. The left panel shows the two (point) sources with identical error patterns. The right panel shows the image made after determining a common error (at an interval of 20 min) for both sources and subtracting their contribution from the data. The sky model has been restored in the right panel. The colourbar (bottom) units are in Jy/PSF.
Current usage metrics show cumulative count of Article Views (full-text article views including HTML views, PDF and ePub downloads, according to the available data) and Abstracts Views on Vision4Press platform.
Data correspond to usage on the plateform after 2015. The current usage metrics is available 48-96 hours after online publication and is updated daily on week days.
Initial download of the metrics may take a while.