Free Access
Fig. 24
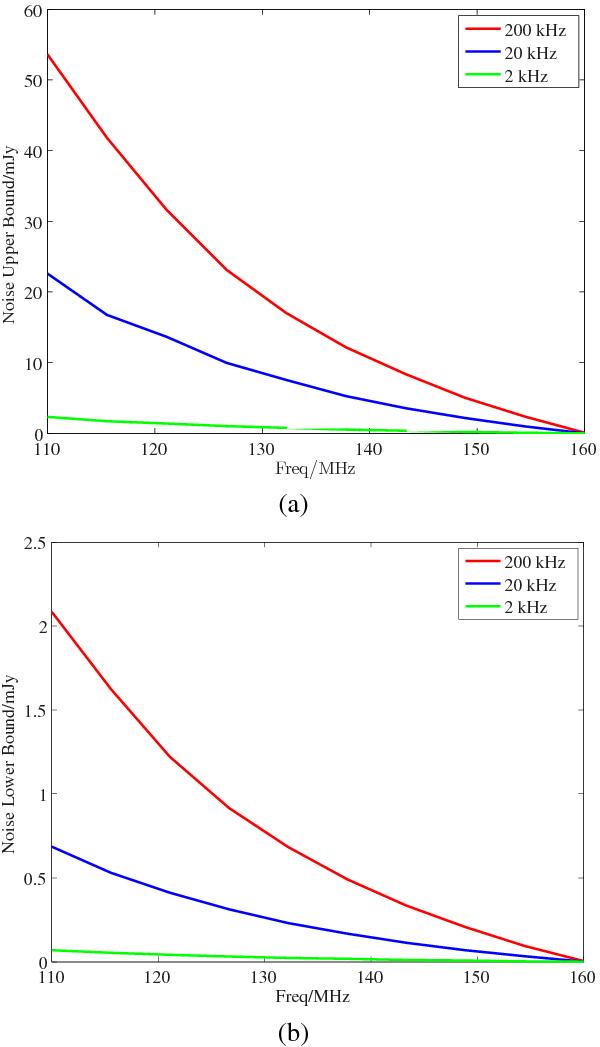
The noise standard deviation due to outlier source for different values of smearing (and differencing) bandwidth. The upper bound is given in a) and the lower bound is given in b). As the smearing bandwidth decreases, the bounds on the noise are also reduced.
This figure is made of several images, please see below:
Current usage metrics show cumulative count of Article Views (full-text article views including HTML views, PDF and ePub downloads, according to the available data) and Abstracts Views on Vision4Press platform.
Data correspond to usage on the plateform after 2015. The current usage metrics is available 48-96 hours after online publication and is updated daily on week days.
Initial download of the metrics may take a while.