Fig. 13
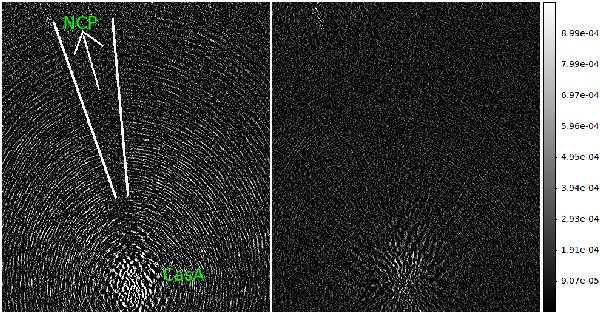
Images of CasA, which is about 30 degrees away from the NCP, made only using the short baselines (<1200 wavelengths). The distorted image of CasA (due to smearing and directional errors) is at the bottom of these figures. The image on the left is obtained after running SAGECal without taking CasA into account. The image on the right is after adding CasA to the sky model and running SAGECal. It is clear that the ripples on the left panel are eliminated on the right panel. Moreover, the left panel shows a “cone” directed towards the NCP where the ripples are absent. The colourbar units are in Jy/PSF.
Current usage metrics show cumulative count of Article Views (full-text article views including HTML views, PDF and ePub downloads, according to the available data) and Abstracts Views on Vision4Press platform.
Data correspond to usage on the plateform after 2015. The current usage metrics is available 48-96 hours after online publication and is updated daily on week days.
Initial download of the metrics may take a while.