Fig. 5
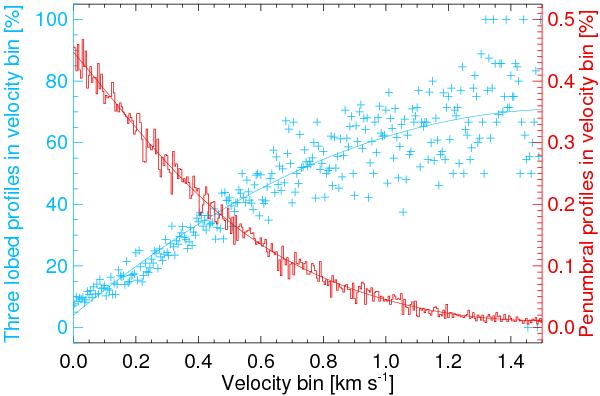
Blue crosses and left axis: percentage of 3-lobe profiles in bins of increasing downflow velocity for Spot D. Red histogram and right axis: fraction of profiles in velocity bin compared to the overall number of penumbral profiles. Solid blue and solid red lines: a second order polynomial and an exponential decay fit, respectively.
Current usage metrics show cumulative count of Article Views (full-text article views including HTML views, PDF and ePub downloads, according to the available data) and Abstracts Views on Vision4Press platform.
Data correspond to usage on the plateform after 2015. The current usage metrics is available 48-96 hours after online publication and is updated daily on week days.
Initial download of the metrics may take a while.