Fig. 9
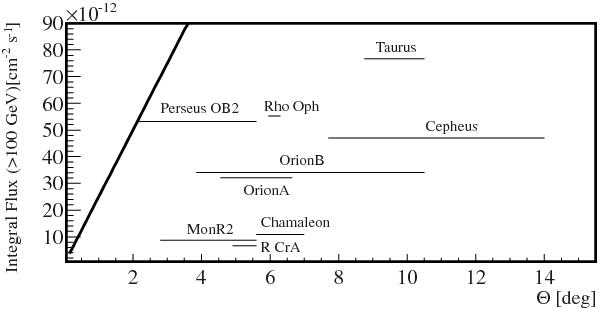
Expected flux from the GMC in the Gould Belt vs. their extension (extension is 70% of the boundaries listed in Dame et al. 1987). Expected flux (>100 GeV) is calculated through Eq. (8), with κ = 1. The solid line is the on-axis sensitivity of CTA (>100 GeV, 50 h; Actis et al. 2011), linearly scaled with the extension of the source. This optimistic scaling holds for an infinite field of view with flat acceptance, while we expect a degradation of sensitivity with increasing angular distance from the center of the field of view.
Current usage metrics show cumulative count of Article Views (full-text article views including HTML views, PDF and ePub downloads, according to the available data) and Abstracts Views on Vision4Press platform.
Data correspond to usage on the plateform after 2015. The current usage metrics is available 48-96 hours after online publication and is updated daily on week days.
Initial download of the metrics may take a while.