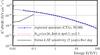
Fig. 4
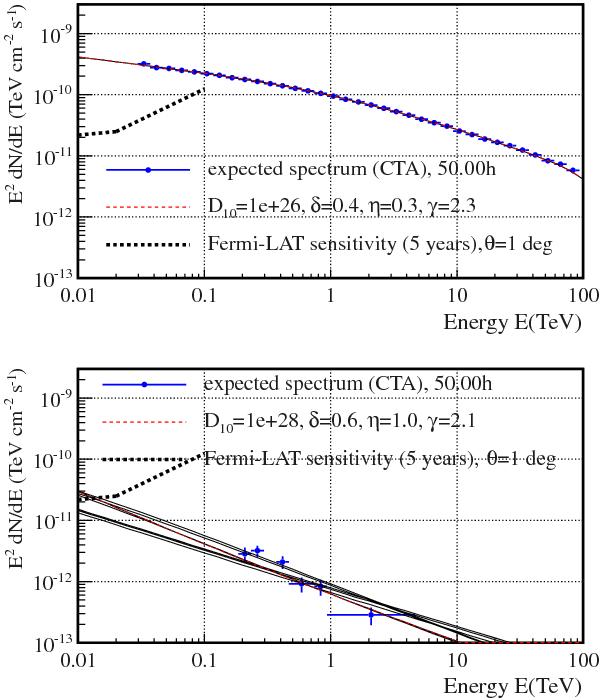
CTA expected performances in the reconstruction of the intrinsic spectral model. Top panel: D10 = 1026 cm2 s-1, δ = 0.4, γ = 2.3, η = 1/3. Bottom panel: D10 = 1028 cm2 s-1, δ = 0.6, γ = 2.1, η = 1. The blue points illustrate one of the possible realizations of the simulated spectral points from 50 h of CTA observation time, the red line identifies the intrinsic spectrum and the black lines represent the accepted models (χ2/d.o.f. + 1). The red intrinsic spectrum is superimposed to one of the accepted models, which, for the case shown in the top panel, is superimposed to the only accepted model.
Current usage metrics show cumulative count of Article Views (full-text article views including HTML views, PDF and ePub downloads, according to the available data) and Abstracts Views on Vision4Press platform.
Data correspond to usage on the plateform after 2015. The current usage metrics is available 48-96 hours after online publication and is updated daily on week days.
Initial download of the metrics may take a while.